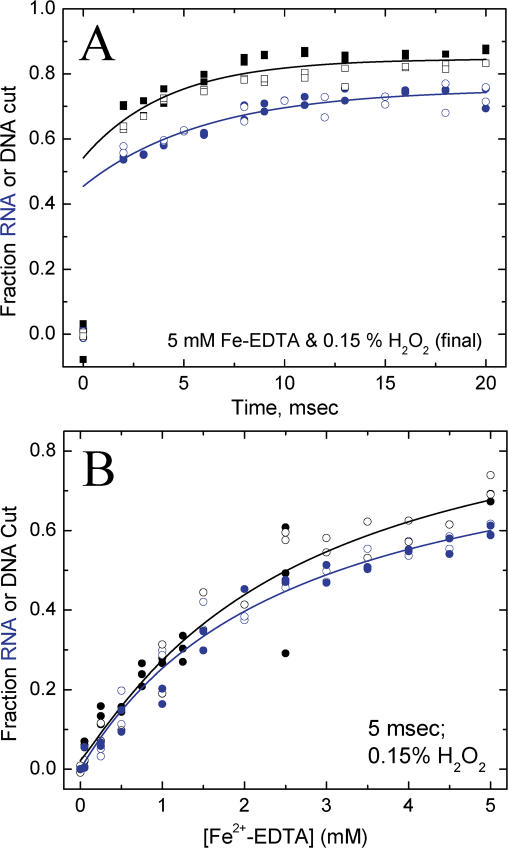
Figure 4.
(A) Dose–response determinations of the ·OH cleavage of DNA (black) and RNA (blue) following exposure of the nucleic acids to 5 mM Fe(II)-EDTA and 44 mM H2O2 for the indicated period of time. The data are best-fit by single exponentials with amplitudes and half-times of Aburst = 0.54 & 0.44, A1 = 0.31 ± 0.02 & 0.30 ± 0.02 and t1 = 4.2 ± 0.9 and 6.1 ± 1.1 ms for DNA and RNA, respectively. The DNA dose–response curve was determined by quantification of the autoradiogram shown in Figure 3B. (B) The extent of ·OH mediated cleavage of DNA (black) and RNA (blue) determined at 44 mM H2O2 with a 5 ms reaction time as a function of Fe(II)-EDTA concentration. The solid lines are fits of the data to a simple saturation function. Open and closed symbols are replicate experiments in both (A) and (B).

