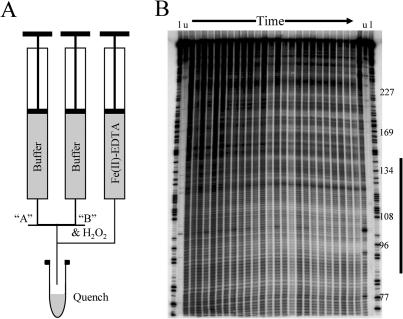
Figure 5.
(A)Schematic representation of an RNA-folding experiment conducted in the quench-flow mixer. In the experiments shown, ‘A’ is the 32P-RNA in buffer and ‘B’ is 20 mM MgCl2 in buffer. The initial concentrations of Fe(II)-EDTA and peroxide are 1.6 mM and 0.81% that yield reagent concentrations after mixing of 0.53 and 80 mM (0.27%), respectively. Samples of 15 µl were mixed; (B) Autoradiogram of a Tetrahymena ribozyme Mg2+-mediated folding kinetics experiment conducted in low-salt buffer at 42°C as described in Materials and Methods. The lanes denoted ‘l’ are the T1 digest ladders while ‘u’ denotes RNA unexposed to ·OH. The numbers along the side denote the nucleotide numbers. The solid bar along the right of the autoradiogram denotes the nucleotides whose density was quantified with single nucleotide resolution in Figure 2 for the Mg2+ folded ribozyme.

