Figure 6.
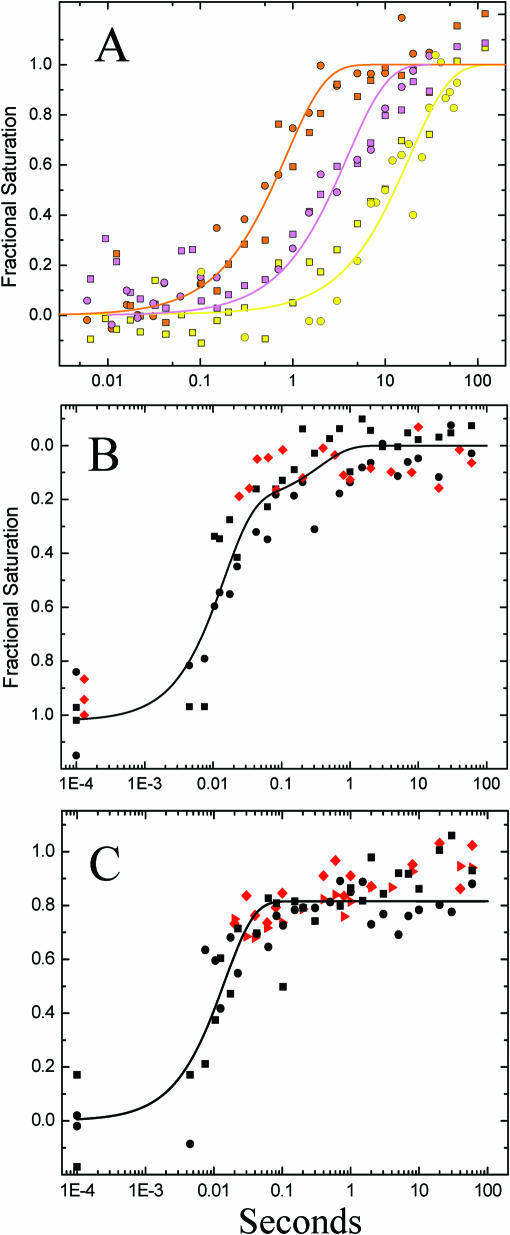
(A) Mg2+-mediated kinetics progress curve obtained under the low-salt initial condition by fast Fenton footprinting; the ·OH protections shown are nt 109–112 (orange), 95–97 (magenta) and 278–281 (yellow) representing the P4–P6 domain, peripheral helices and catalytic core protections, respectively. The initial concentrations of Fe(II)-EDTA and peroxide are 1.6 mM and 0.81% that yield reagent concentrations after mixing of 0.53 and 80 mM (0.27%), respectively. The best-fits are to a single exponential decay with rates of 1.19 ± 0.13, 0.21 ± 0.03 and 0.070 ± 0.009 s−1, respectively; (B) Mg2+-mediated kinetics progress curve obtained under the high-salt initial condition for nt 122 located in the ‘hinge’ linking P5abc with P4-P5-P6 by fast Fenton (•) and synchrotron (•) footprinting. The ·OH reactivity of this nucleotide increases during Mg2+-mediated folding resulting in inversion of the fractional saturation. The solid line depicts the best-fit values to a double exponential decay with k1 = 70.7 (−13.0, +25.1) s−1, k2 = 2.8 (−1.8, +6.0) s−1, A1 = 0.81 ± 0.08 and A2 = 0.21 ± 0.14; (C) Mg2+-mediated kinetics progress curve obtained under the high-salt initial condition for nt 139–140 located within the P4–P6 domain by fast Fenton (•) and synchrotron (43) (•) footprinting. The solid line depicts the best-fit of the fast Fenton data to a single exponential with k1 = 69.8 ± 0.9 s−1. The squares and circles represent independent experiments. The data points shown at ∼ IE-4 in panels B and C represent the Mg2+-free RNA.

