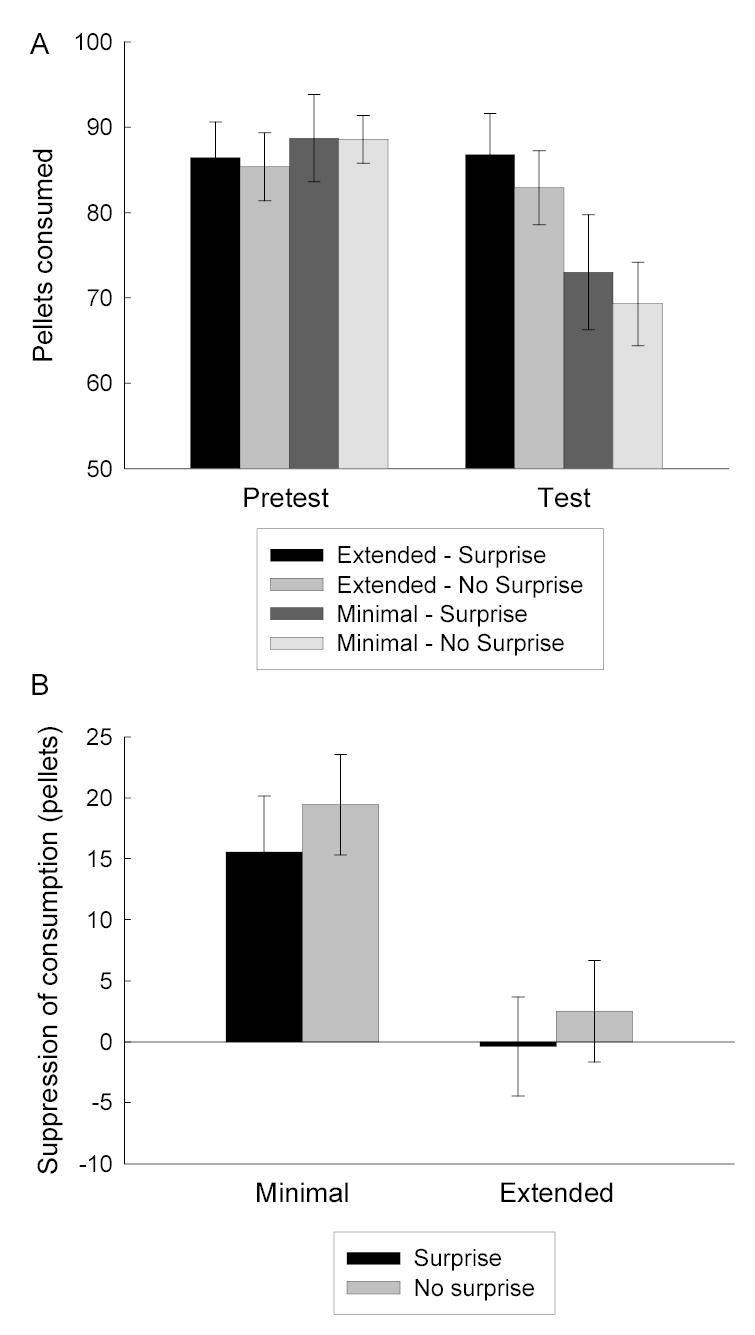
Figure 2.

Mediated food aversion learning in Experiment 1. Panel A shows mean (±sem) food consumption in the pretest and test phases and Panel B shows the mean (±sem) change in consumption between those tests (pretest minus test). In Panel B, reductions in consumption (positive change scores) reflect the acquisition of a food aversion.
