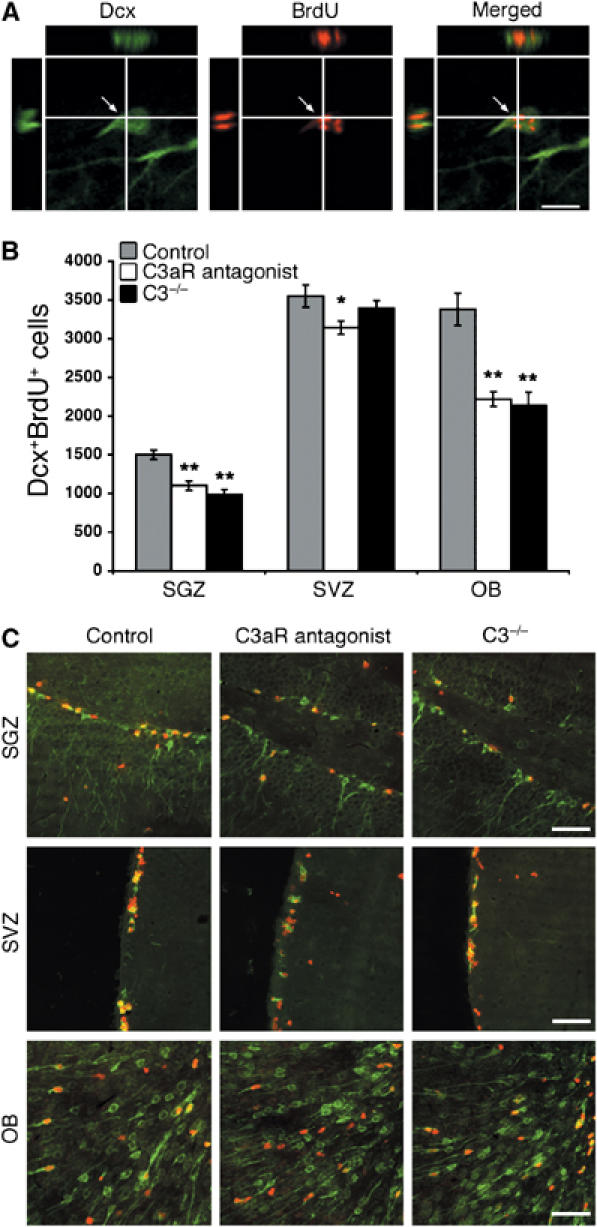
Figure 3.

Proliferating migrating neuroblast in the dentate gyrus SGZ visualized by confocal microscopy in an orthogonal projection composed of 14 optical z-planes, 0.5 μm thick (A). The number of DcxposBrdUpos cells in SGZ, SVZ, and OB in control mice (n=12), C3−/− mice (n=6), and mice treated with C3aR antagonist (n=10) (B). Representative low-power images of DcxposBrdUpos cells in SGZ, SVZ, and OB in the three groups of mice; Dcx, green, BrdU, red (C). Values are the number of cells per region. *P<0.05, **P<0.0005. Scale bars equal 10 μm (A) and 200 μm (C).
