
Figure 6.
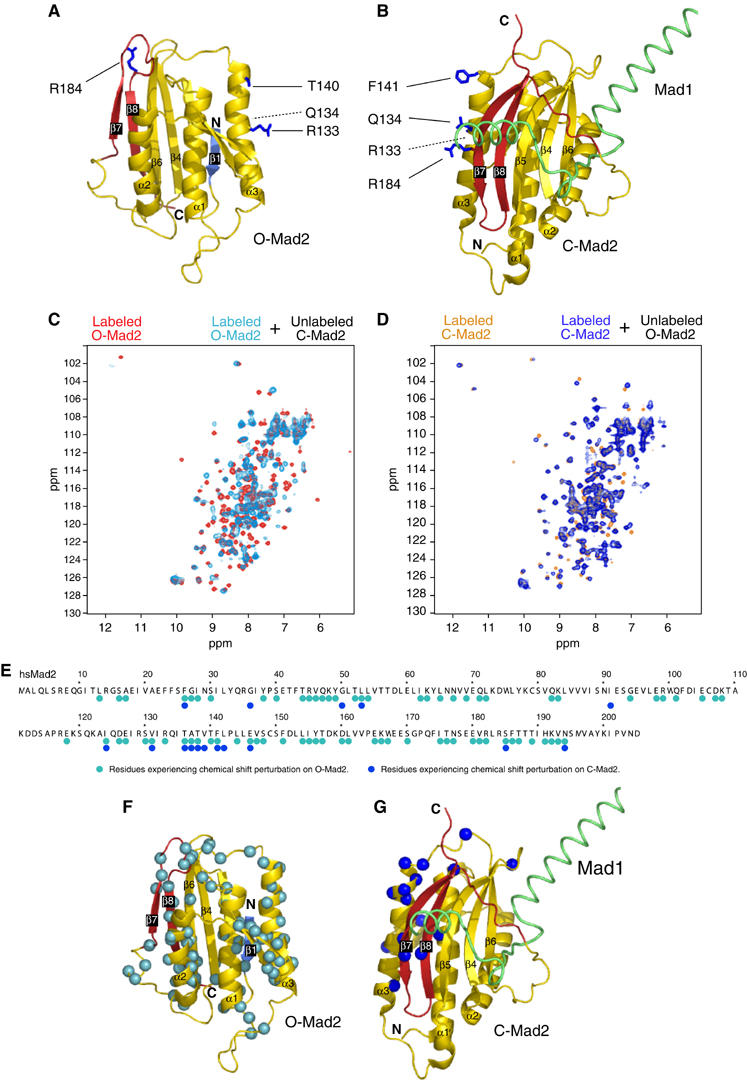
NMR analysis of O-Mad2:C-Mad2 dimer. (A) Ribbon model of O-Mad2. Secondary structure is color-coded as in Figure 1. O-Mad2 residues required to bind C-Mad2 are in blue and ball-and-sticks. (B) C-Mad2 analyzed as in (A). (C) NMR chemical shift perturbation. The spectrum of O-Mad2ΔC (red) was superimposed with that of 1H,15N-labeled O-Mad2ΔC bound to equimolar unlabeled C-Mad2wt:Cdc20 (cyan). (D) The spectrum of C-Mad2wt (orange) was superimposed with that of 1H,15N-labeled C-Mad2wt bound to equimolar unlabeled O-Mad2ΔC (dark blue). (E) Summary of chemical shift perturbations monitored in 2D 1H,15N-HSQC experiments reported exclusively for residues that could be unambiguously assigned in the free and bound state. (F) The Cα atoms of residues in O-Mad2 whose amide's chemical shifts had changed are displayed as cyan spheres. (G) As in panel (F) for C-Mad2, with chemical shift perturbations indicated by dark blue spheres.