
Figure 1.
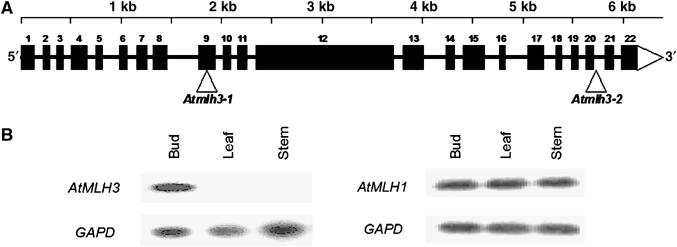
(A) Map of the 6.3 kb At4g35520 locus showing the exon/intron organization of AtMLH3. The exons are shown as numbered black boxes. The triangles indicate the T-DNA insertion sites in Atmlh3-1 and Atmlh3-2. (B) RT–PCR expression analysis revealing that in contrast to AtMLH1, expression of AtMLH3 is restricted to reproductive tissue.