
Table 2. HEMATOCRIT AND DIFFERENTIAL WHITE BLOOD COUNT
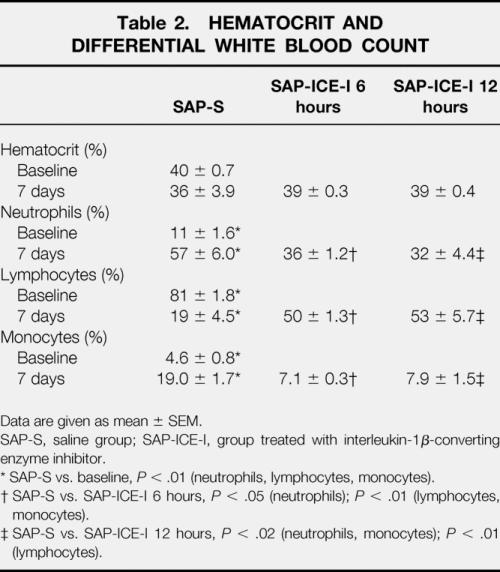
Data are given as mean ± SEM.
SAP-S, saline group; SAP-ICE-I, group treated with interleukin-1β-converting enzyme inhibitor.
* SAP-S vs. baseline, P < .01 (neutrophils, lymphocytes, monocytes).
† SAP-S vs. SAP-ICE-I 6 hours, P < .05 (neutrophils);P < .01 (lymphocytes, monocytes).
‡ SAP-S vs. SAP-ICE-I 12 hours, P < .02 (neutrophils, monocytes);P < .01 (lymphocytes).