
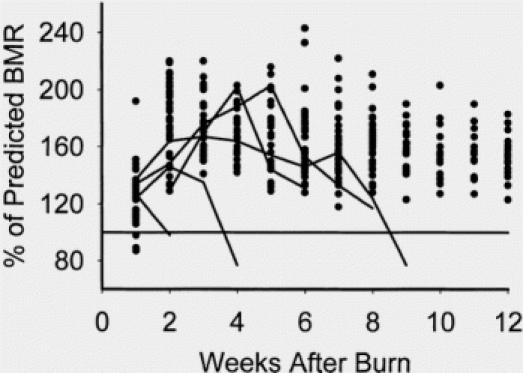
Fig. 3. Plot of resting energy expenditures expressed as percentage of predicted basal metabolic rate from the Harris-Benedict equation. Points are from survivors, and lines are from nonsurvivors. Nonsurvivors were characterized by a drop in resting energy expenditure before death.