
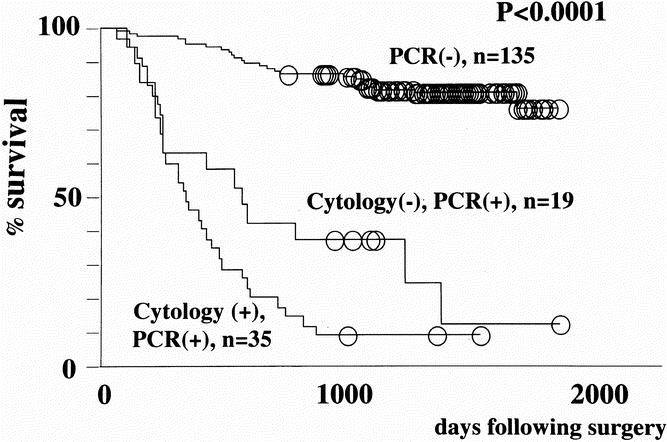
Figure 3. Survival curves of all 189 patients with gastric carcinomas stratified according to the results of cytology and real-time RT-PCR. A cut-off value of 30 for CEA/GAPDH ratio was employed.
Official websites use .gov
A
.gov website belongs to an official
government organization in the United States.
Secure .gov websites use HTTPS
A lock (
) or https:// means you've safely
connected to the .gov website. Share sensitive
information only on official, secure websites.
Figure 3. Survival curves of all 189 patients with gastric carcinomas stratified according to the results of cytology and real-time RT-PCR. A cut-off value of 30 for CEA/GAPDH ratio was employed.