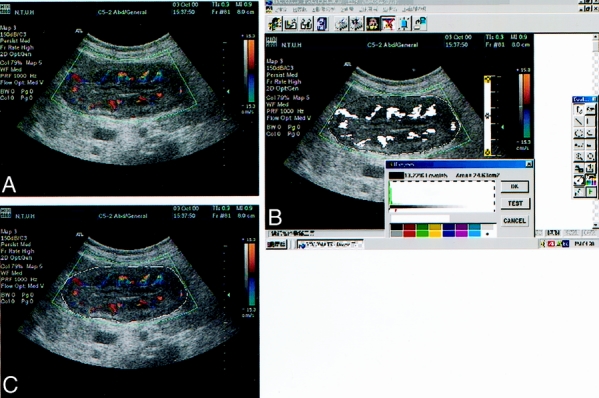
Figure 1. Color Doppler vascularity index assessment within the gastric cancer. The color window was set to cover the whole tumor on the screen and stored for later quantitative analysis (A). The tumor margin was contoured using a cursor (B). Quantification of the vascular color signals within the demarcated tumor was then automatically executed by special software called Encomate (Electronic Business Machine Co., Ltd., Taiwan). The results were expressed as the ‘color Doppler vascularity index‘ (the number of colored pixels within the tumor section/the number of total pixels in that particular tumor section) (C).
