
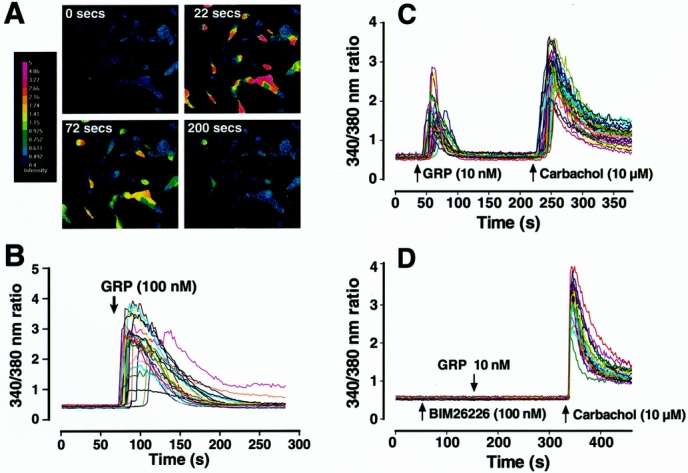
Figure 4. Intracellular calcium [Ca2+]i mobilization in SK-N-SH (A, B) and LAN-1 cells (C, D). (A) Pseudocolor images represent the relative [Ca2+]i as shown by the color bar (left). Red-shifted colors indicate higher Ca2+ activation. (B) Graph depicts [Ca2+]i over a time course after GRP treatment (100 nmol/L). Each line represents a single cell measurement. (C) Graph depicts [Ca2+]i over a time course after GRP (10 nmol/L) treatment in LAN-1 cells. To ensure the ability of cells to reproduce a calcium response, GRP treatment was followed with carbachol (10 μmol/L) treatment, which also produced a brisk [Ca2+]i response. (D) Graph depicting [Ca2+]i concentration pretreated with BIM26226 (100 nmol/L), a specific GRP-receptor antagonist, before GRP (10 nmol/L) treatment in LAN-1 cells.