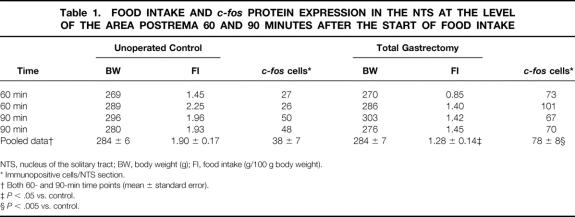
Table 1. FOOD INTAKE AND c-fos PROTEIN EXPRESSION IN THE NTS AT THE LEVEL OF THE AREA POSTREMA 60 AND 90 MINUTES AFTER THE START OF FOOD INTAKE
NTS, nucleus of the solitary tract; BW, body weight (g); FI, food intake (g/100 g body weight).
* Immunopositive cells/NTS section.
† Both 60- and 90-min time points (mean ± standard error).
‡P < .05 vs. control.
§P < .005 vs. control.

