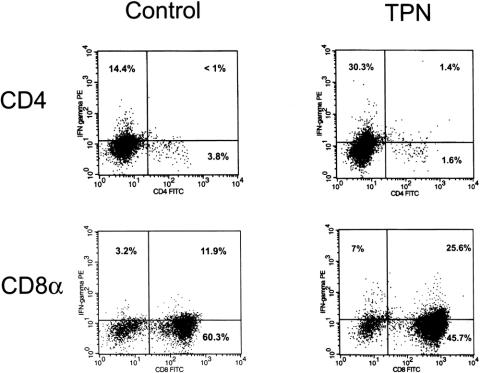
Figure 4. Results of intracellular staining of IFN-γ. The gated subpopulations IEL are shown for both control and TPN groups (n = 6 per group). The percentages of each quadrant are shown, with the right upper quadrant representing IFN-γ-positive cells in the respective cell population. See the “Results” section for the mean percentage of IFN-γ expression in individual cell populations.

An official website of the United States government
Here's how you know
Official websites use .gov
A
.gov website belongs to an official
government organization in the United States.
Secure .gov websites use HTTPS
A lock (
) or https:// means you've safely
connected to the .gov website. Share sensitive
information only on official, secure websites.
