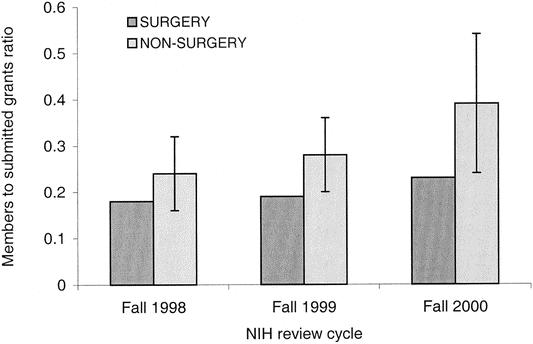
Figure 5. Relative concentration of study section participants to the number of annually submitted grants from surgical and nonsurgical departments (FY 1998–2000 fall cycles). Nonsurgeons exhibited 35 to 65% greater peer-review activity to nonsurgeons when normalized to grant submission activity (P = .015 for the 3-year period; annual mean ratio ± SD for nonsurgery group).
