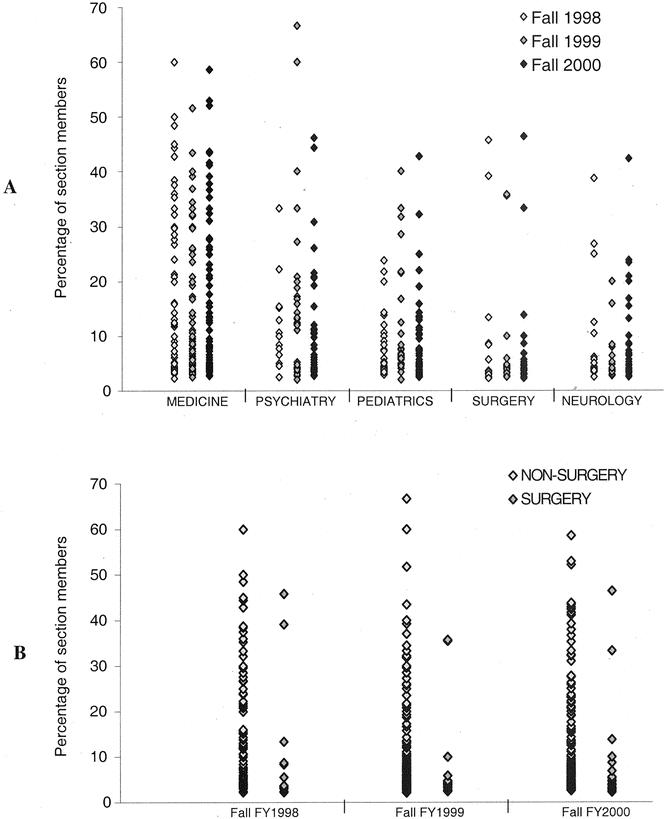
Figure 6. Scatterplot of individual study sections containing members from each clinical department. Each plot represents one section where at least one member from the relavent department was participating. Location of the y-axis represents the percentage of all members in that section. (B) Participants from the nonsurgical group were concentrated on sections with relatively greater proportions than surgeons for each year examined (FY 1998: P = .032; FY 1999: P = .004; FY 2000: P = .002).
