
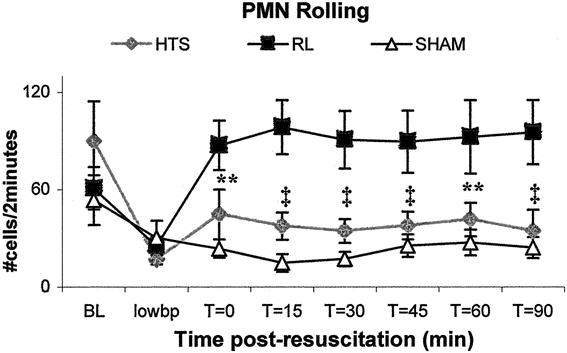
Figure 2. RL animals displayed more rolling neutrophils than either HTS or sham groups. Values are expressed as mean number of rolling neutrophils per 2-minute period ± SEM. **RL versus sham only, P < .05. ‡RL versus either HTS or sham, P < .05. There were no significant differences between HTS and sham at any time point.