
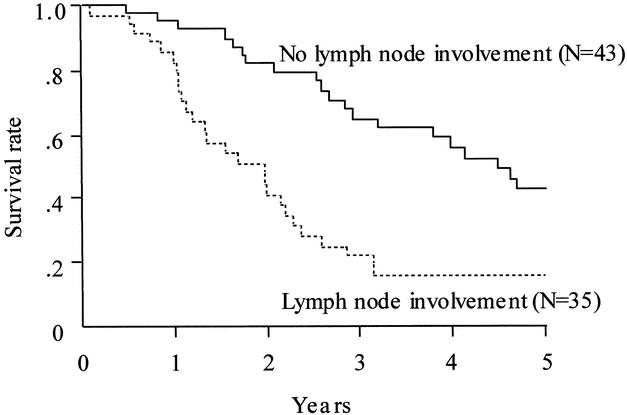
FIGURE 3. Patient survival stratified according to the lymph node involvement status. The solid line indicates survival of patients without lymph node involvement (n = 43; median survival, 53.7 mo; 1-, 3-, and 5-y survival rates = 95.1%, 64.7%, and 42.4%, respectively). The dotted line indicates survival of patients with lymph node involvement (n = 35; median survival, 23.5 mo; 1-, 3-, and 5-y survival rates = 82.4%, 22.2%, and 15.9%, respectively). Survival was significantly longer in patients without than with lymph node involvement (P = 0.0001).