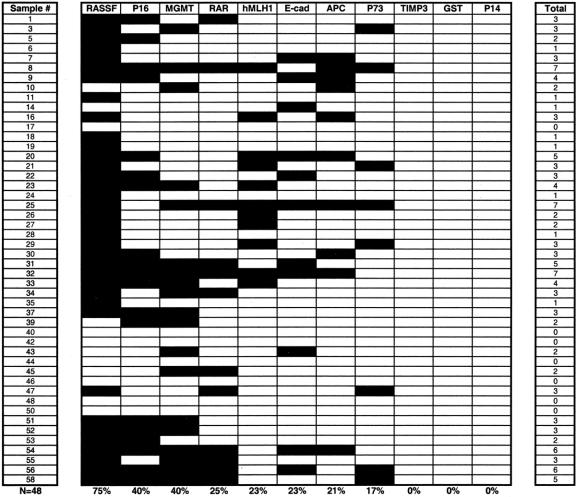
FIGURE 3. A methylation profile of 11 tumor suppressor genes in 48 PENs. Shaded boxes represent the presence of aberrant gene promoter methylation. The total number of methylated gene markers for each tumor is indicated in the right column. The frequency of methylation for each gene within the entire group of PENs is noted.

An official website of the United States government
Here's how you know
Official websites use .gov
A
.gov website belongs to an official
government organization in the United States.
Secure .gov websites use HTTPS
A lock (
) or https:// means you've safely
connected to the .gov website. Share sensitive
information only on official, secure websites.
