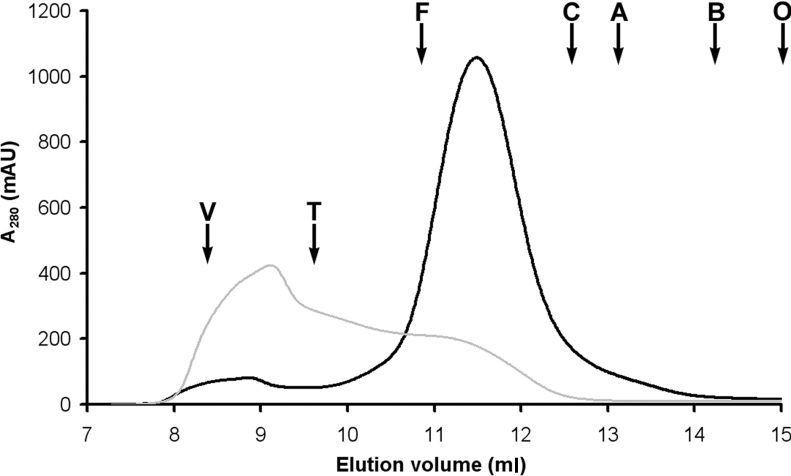
Figure 3. SEC of BmrA in 0.05% DDM (black line) and in 0.02% C12E8 (grey line).
Conditions are described in the Experimental section. Typical elution profiles (A280) are shown with the positions of calibration markers: T, thyroglobulin; F, ferritin; C, catalase; A, aldolase; B, bovine serum albumin; O, ovalbumin. The void volume is indicated by V. AU, absorbance units.

