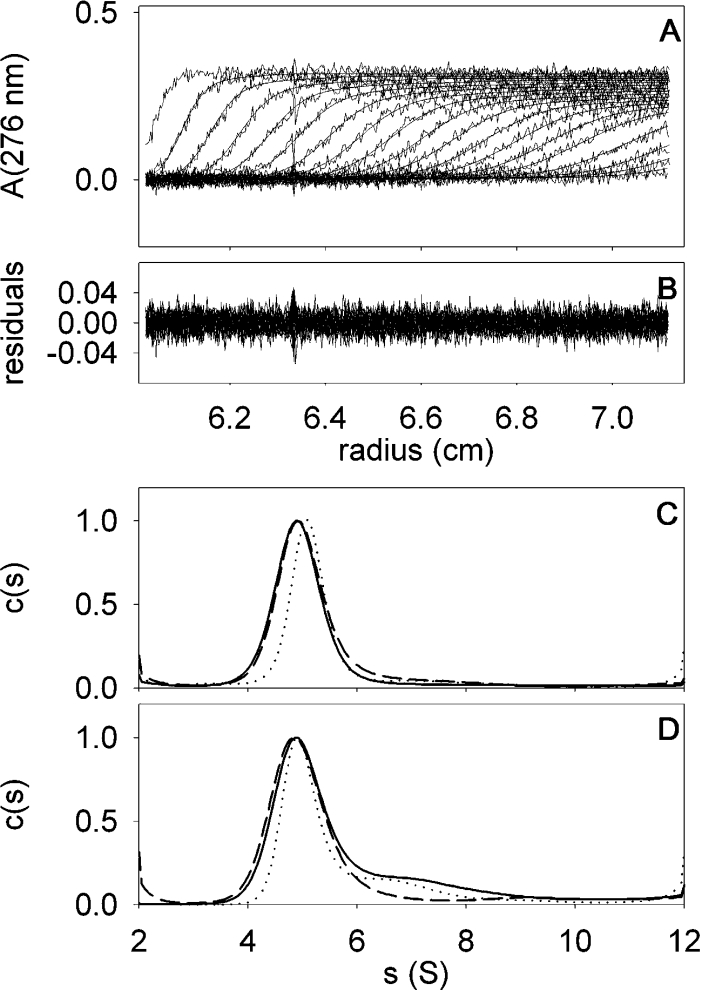
Figure 5. Sedimentation-velocity of BmrA in the presence of 0.05 and 0.01% DDM.
Panel A, superimposed experimental sedimentation profiles and the fitted curves from the c(s) analysis (using Sedfit) of BmrA at 0.5 mg/ml in the presence of 0.05% DDM. The last profile corresponds to 6 h sedimentation at 42000 g and 20 °C. The statistical noise has been subtracted. Panel B, superimposed differences between the experimental and fitted curves from Panel A. Panel C, c(s) analysis of BmrA, in the presence of 0.05% DDM at 0.13, 0.5 and 1.2 mg/ml (continuous, dotted and dashed lines respectively). Panel D, c(s) analysis of BmrA, with 0.01% DDM at 0.3, 0.9 and 0.24 mg/ml (continuous, dotted and dashed lines respectively), the latter sample was diluted before the experiments from a sample at 0.05% DDM, and the two others were from SEC. A detailed description is given in the Experimental section.

