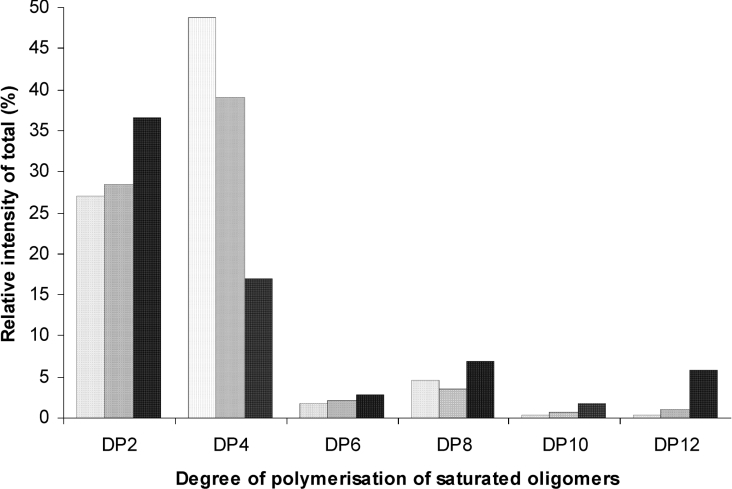
Figure 10. Relative intensities of total of saturated oligomers in the M-lyase (H. tuberculata) digests of DP12 MG-oligomers.
Control (non-epimerized), FG=0.47 (light-grey bars to the left); AlgE1-epimerized, FG=0.52 (dark-grey bars in the middle); AlgE6-epimerized, FG=0.65 (black bars to the right). The digests were analysed by FIA-MS in negative ion mode. Quantitative analysis was performed by integrating a ±10 p.p.m. window for each m/z and the contributions from the generated ions, [M−H+]−, [M−2H+]2−, [M−3H+]3−, [M−4H+]4−, were summed for each chain length. Only the chain lengths with an even number of residues are shown, due to the degradation pattern of the lyase and low intensities of odd numbered oligomers.

