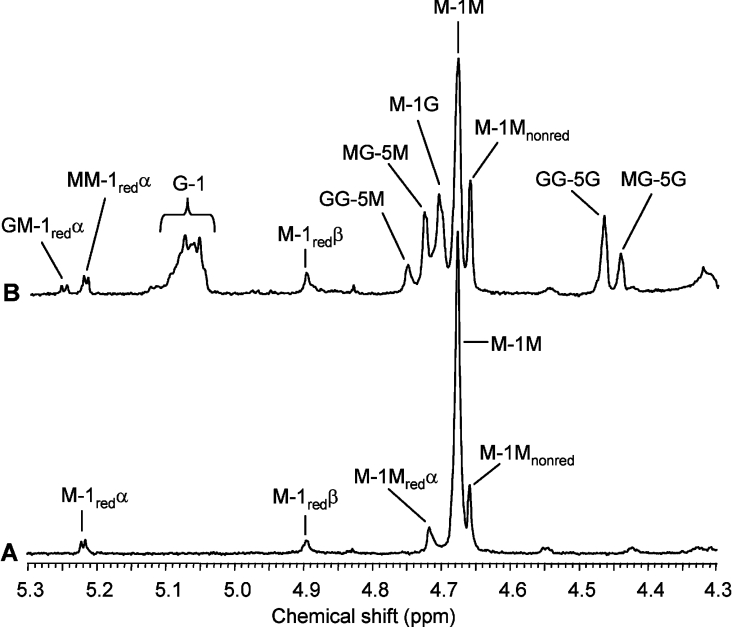
Figure 8. 1H-NMR (500 MHz) spectra of control (non-epimerized) (A) and AlgE6-epimerized (B) mannuronate undecamer.
The oligomannuronic acid sample in (A) was treated with the epimerase for 24 h and an increase in FG from 0.0 to 0.30 (FGG=0.15) (B). The α-anomeric resonance signal of the reducing end at 5.22 p.p.m. (A) shifts down-field to 5.24 p.p.m. when the penultimate residue is epimerized (B).

