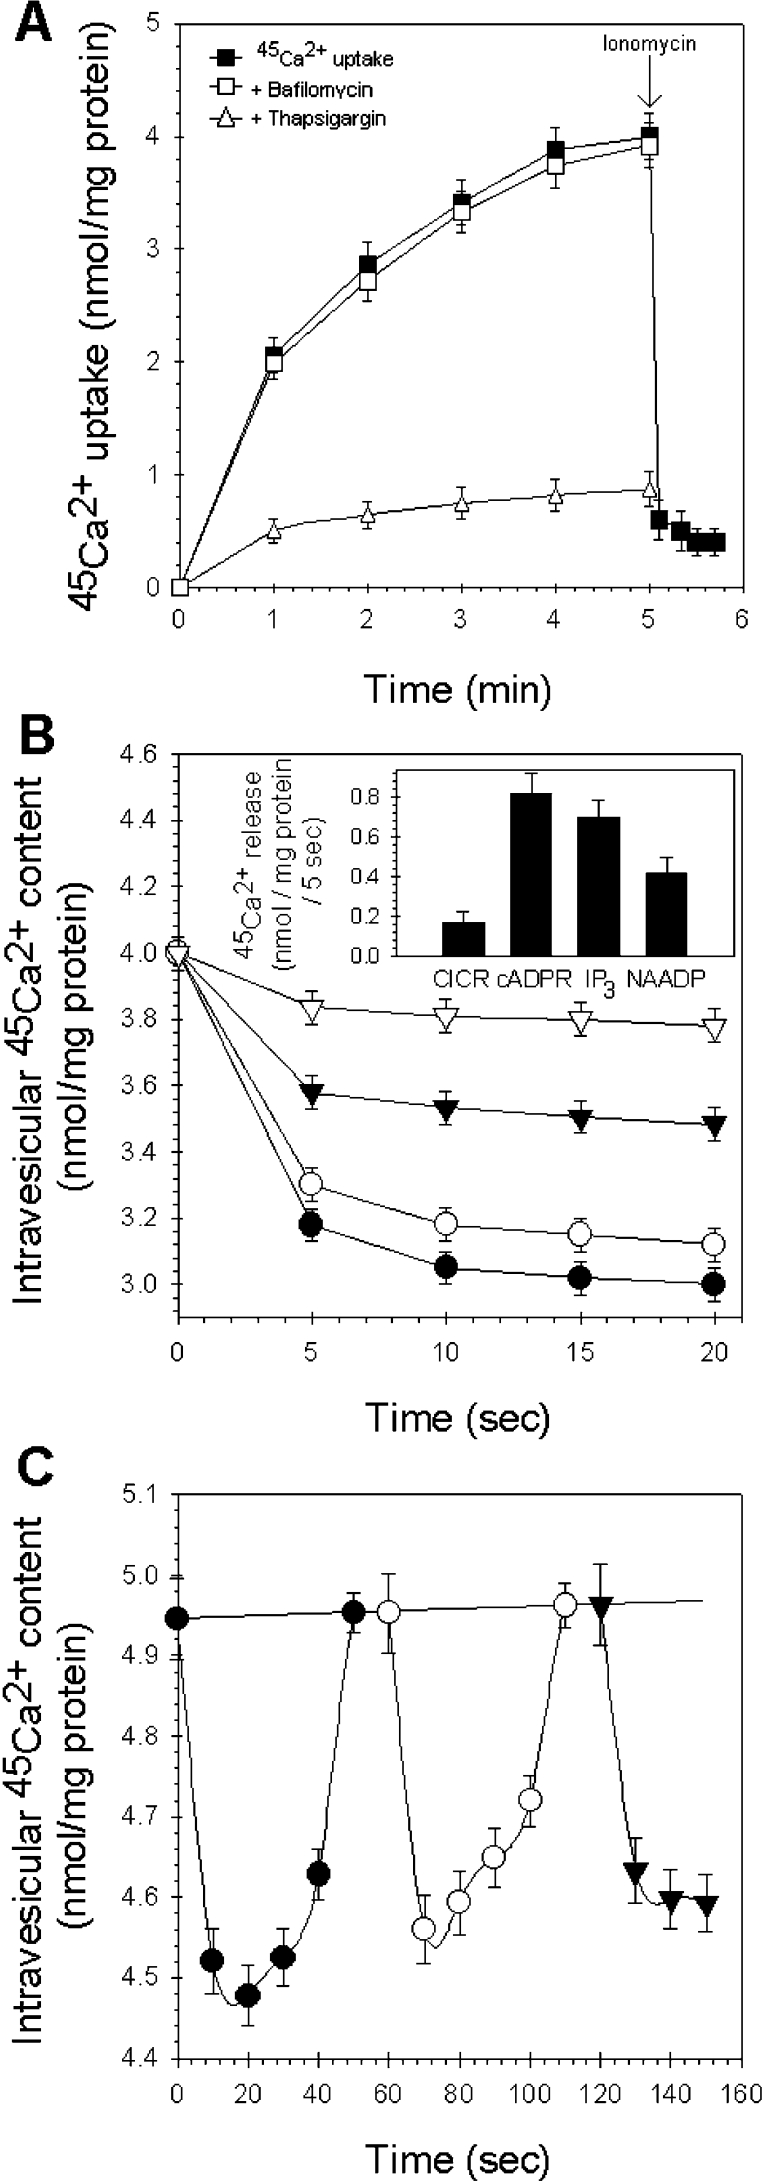
Figure 1. NAADP-induced 45Ca2+ release from active loaded hepatocyte microsomes.
(A) The time course of the Ca2+ uptake by liver microsomes was determined using 45Ca2+, as described in the Materials and methods section. Accumulation (■) of Ca2+ was started by addition of 1 mM ATP. The amount of mobilizable Ca2+ was determined by adding 5 μM ionomycin (arrow) to the medium. The effect on 45Ca2+ uptake of 1 μM thapsigargin (△) and 1 μM bafilomycin A1 (□) was also tested. Bafilomycin A1 was added to the microsomes 5 min before 45Ca2+ uptake was initiated. (B) Comparison of the Ca2+-mobilizing characteristics of IP3 (○), cADPR (●) and NAADP (▼) (10 μM each). CICR (▽) was determined by adjusting extravesicular free Ca2+ levels to pCa 6 using EGTA (100 μM). Results are means±S.E.M. for six to twelve determinations on at least four different experimental days. The inset shows the total amount of Ca2+ efflux triggered by IP3, cADPR and NAADP after 5 s of Ca2+ release. (C) Microsomes sequestered Ca2+ in the presence of an ATP-regenerating system (2 units/ml creatine-kinase and 4 mM phosphocreatine) and released calcium in response to subsequent addition of cADPR (●, 10 μM), IP3 (○, 10 μM) and NAADP (▼, 10 μM).

