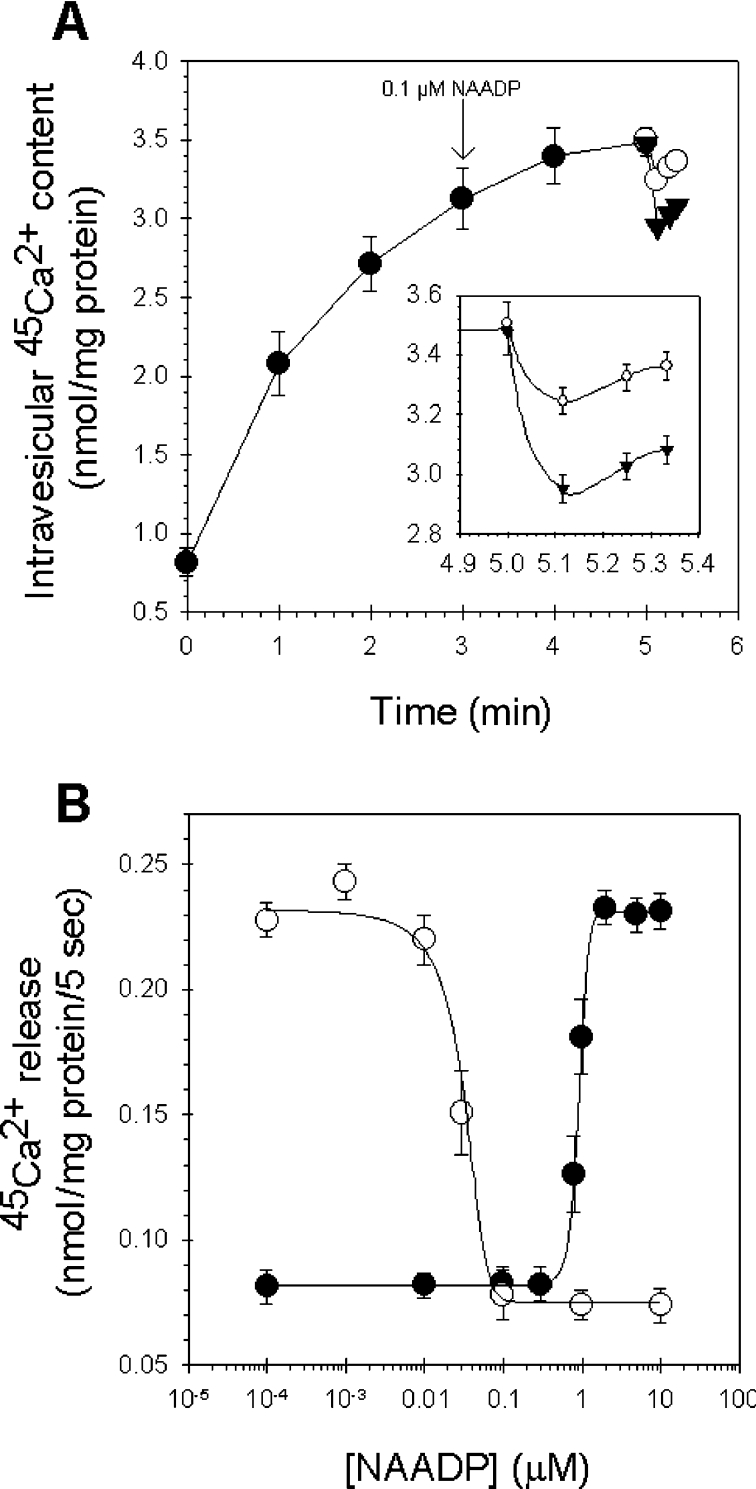
Figure 3. Unique homologous desensitization pattern of the NAADP receptors.
(A) Homologous desensitization of NAADP receptors by subthreshold concentrations of NAADP. Actively loaded microsomes (●) were pre-treated with 0.1 μM NAADP for 2 min (starting 3 min after uptake was initiated, indicated by the arrow) and were then challenged to a supramaximal concentration of NAADP (10 μM, ○). NAADP-induced Ca2+ release from non-pre-treated microsomes (▼). The inset shows the Ca2+ efflux at 5 min of Ca2+ loading from microsomes incubated with non-activating concentrations of NAADP and non-pre-treated microsomes. (B) Dose–response curve of NAADP (●) and the residual Ca2+ release by a supramaximal concentration of NAADP (10 μM) after 2 min of pre-incubation with concentrations of NAADP between 0.1 nM and 10 μM (○).

