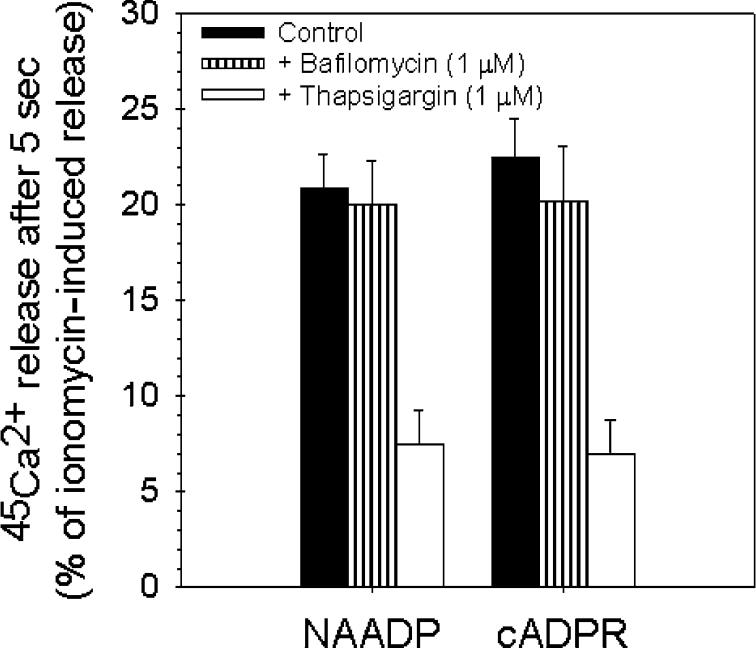
Figure 4. Effects of thapsigargin and bafilomycin A1 on the cADPR- and NAADP-elicited Ca2+ release in rat liver microsomes.
The actively loaded vesicles were pre-incubated with thapsigargin (1 μM) for at least 2 min and with bafilomycin A1 (1 μM) for at least 5 min before Ca2+ release was induced with supramaximal concentrations of cADPR and NAADP (both 10 μM). Closed bars represent the Ca2+ release from non-pre-treated microsomes, while open bars show the Ca2+ efflux from microsomes treated with thapsigargin (1 μM) and hatched bars represent the effect of bafilomycin A1 (1 μM).

