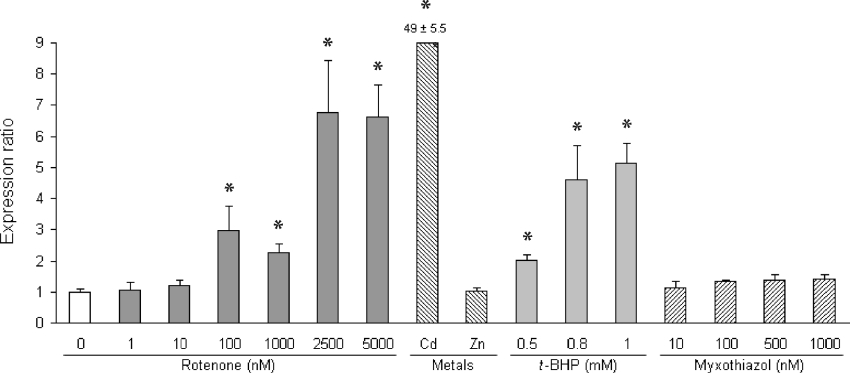
Figure 2. MT2A RNA expression in rotenone-treated HeLa cells.
MT2A RNA expression and total MT protein levels in cells were determined as described in the Experimental section. Normalized RNA expression levels are expressed as the mean ratio ±S.D. (n=3) relative to untreated cells (open bar). Asterisks indicate statistically significant values (P<0.05) compared with the untreated cells. Expression levels were compared in cells treated with rotenone, metal inducers CdCl2 (12.5 μM) and ZnCl2 (250 μM), t-BHP and myxothiazol as indicated. The value for Cd-induced expression is indicated above the bar.

