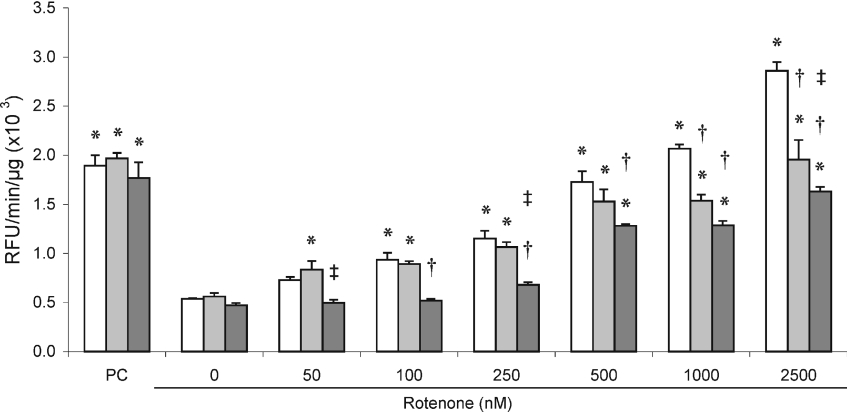
Figure 8. Caspase 3/7 activation in rotenone-treated MT-overexpressing HeLa cells.
Caspase 3/7 activity was measured in MT-overexpressing (MT1B, light grey bars; MT2A, dark grey bars) and control cell lines (open bars) treated with rotenone as described in the Experimental section. Reaction velocities are indicated as change in relative fluorescence units (RFU) per μg of total protein. Staurosporine treatment (1 μg/ml for 2 h) was the positive control (PC) for caspase activation. Values are means±S.D. (n=3). *P<0.05 when compared with untreated cells of the same cell line; †P<0.05 when compared with control cell line at the same treatment; ‡P<0.05 when comparing MT2A- with MT1B-overexpressing cell line at the same treatment.

