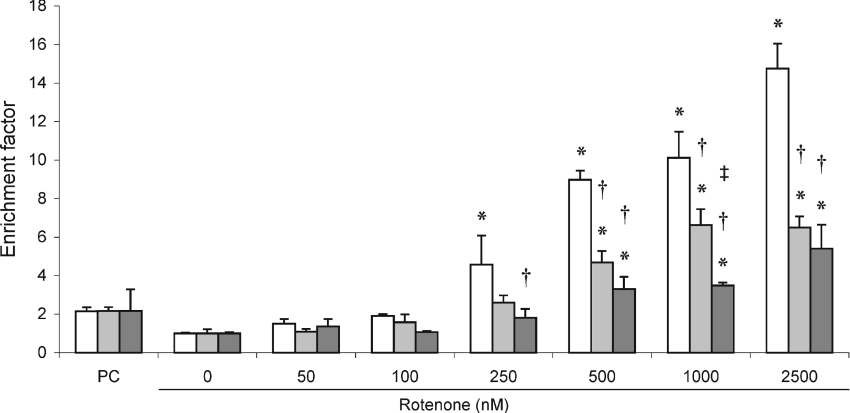
Figure 9. Cytosolic nucleosome enrichment in rotenone-treated MT-overexpressing HeLa cells.
Cytosolic nucleosome enrichment was determined in MT1B- (light grey bars), MT2A- (dark grey bars) overexpressing and control (open bars) cells treated with rotenone for 24 h or staurosporine (1 μg/ml for 2 h) as positive control (PC). Values, normalized relative to protein content, are indicated as a mean fold change (±S.D., n=3) relative to untreated cells. *P<0.05 when compared with untreated cells of the same cell line; †P<0.05 when compared with control cell line at the same treatment; ‡P<0.05 when comparing MT2A with MT1B-overexpressing cell line at the same treatment.

