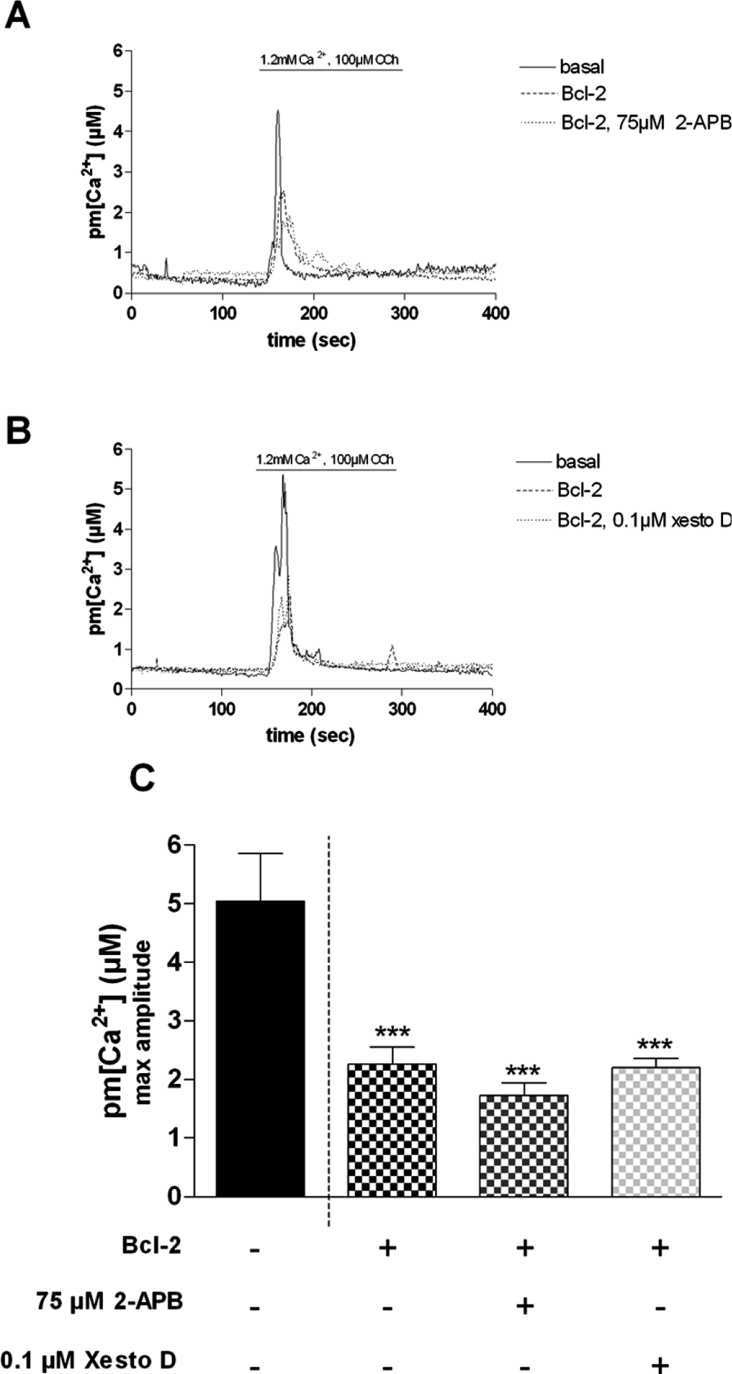
Figure 3. Effect of IP3R inhibitors on Bcl-2-transfected dystrophic myotubes.
Representative traces of Ca2+ increases in a population of mdx myotubes showing the effect of Bcl-2 overexpression alone and Bcl-2 overexpression together with (A) 75 μM 2-APB or (B) xestospongin D (xesto D; 0.1 μM) on the CCh-induced Ca2+ response. (C) Summarizing histogram. The bar graphs correspond to mean pm[Ca2+] values±S.E.M.; n≥8; *** corresponds to a significant inhibition (P<0.001) using one-way ANOVA followed by a Dunnett post-hoc test when compared with the control bar, e.g. 1.2 mM Ca2+, 100 μM CCh, no Bcl-2 overexpression.

