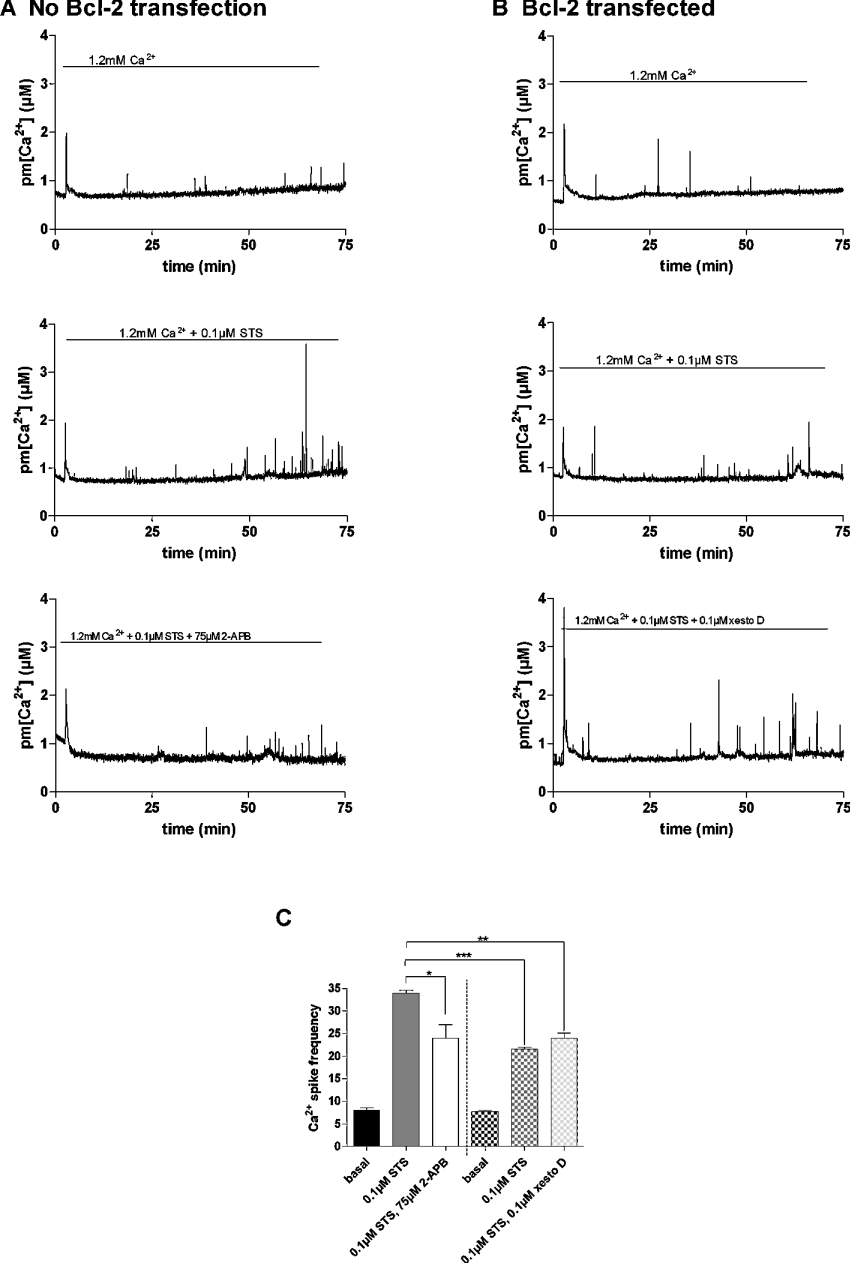
Figure 6. Effects of STS on plasma membrane Ca2+ spikes in dystrophic myotubes.
Representative trace of the effect of STS (0.1 μM) in the presence or absence of IP3R inhibitors on the pm[Ca2+] spikes in (A) control dystrophic myotubes and (B) in dystrophic myotubes that overexpress Bcl-2. (C) Summarizing histogram of the mean plasma membrane Ca2+ spike frequency (n≥3). Frequency was calculated manually and represents spikes that point out from the basal pm[Ca2+]. Plain columns represent dystrophic myotubes that were not transfected with Bcl-2. Hatched columns represent Bcl-2-overexpressing dystrophic myotubes. *, ** and *** correspond to a significant decrease (P<0.05, 0.01<P<0.001 and P<0.001 respectively) using Student's t test. xesto D, xestospongin D.

