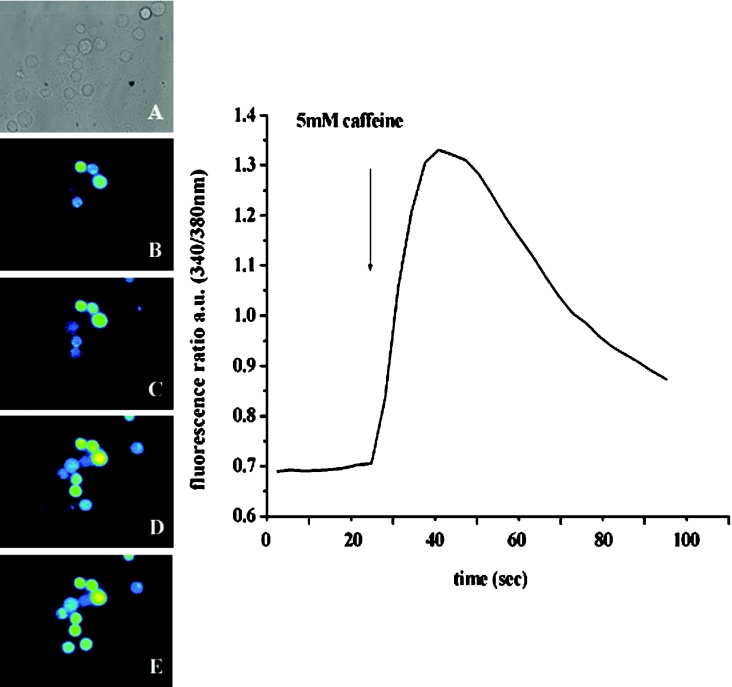
Figure 5. Ca2+ release stimulated by caffeine in individual EBV-immortalized lymphoblastoid cells from a control individual.
(A) Phase-contrast; (B–E), single-cell [Ca2+]i measurements of fura-2-loaded lymphoblastoid cells from control individuals: (B) resting [Ca2+]I, (C) 36 s, (D) 50 s and (E) 77 s after the application of 10 mM caffeine. Cells were individually stimulated by addition of caffeine in Krebs–Ringer solution containing 1 mM CaCl2. The trace in the right-hand panel is a representative trace obtained after stimulation of a single cell with 5 mM caffeine (arrow).

