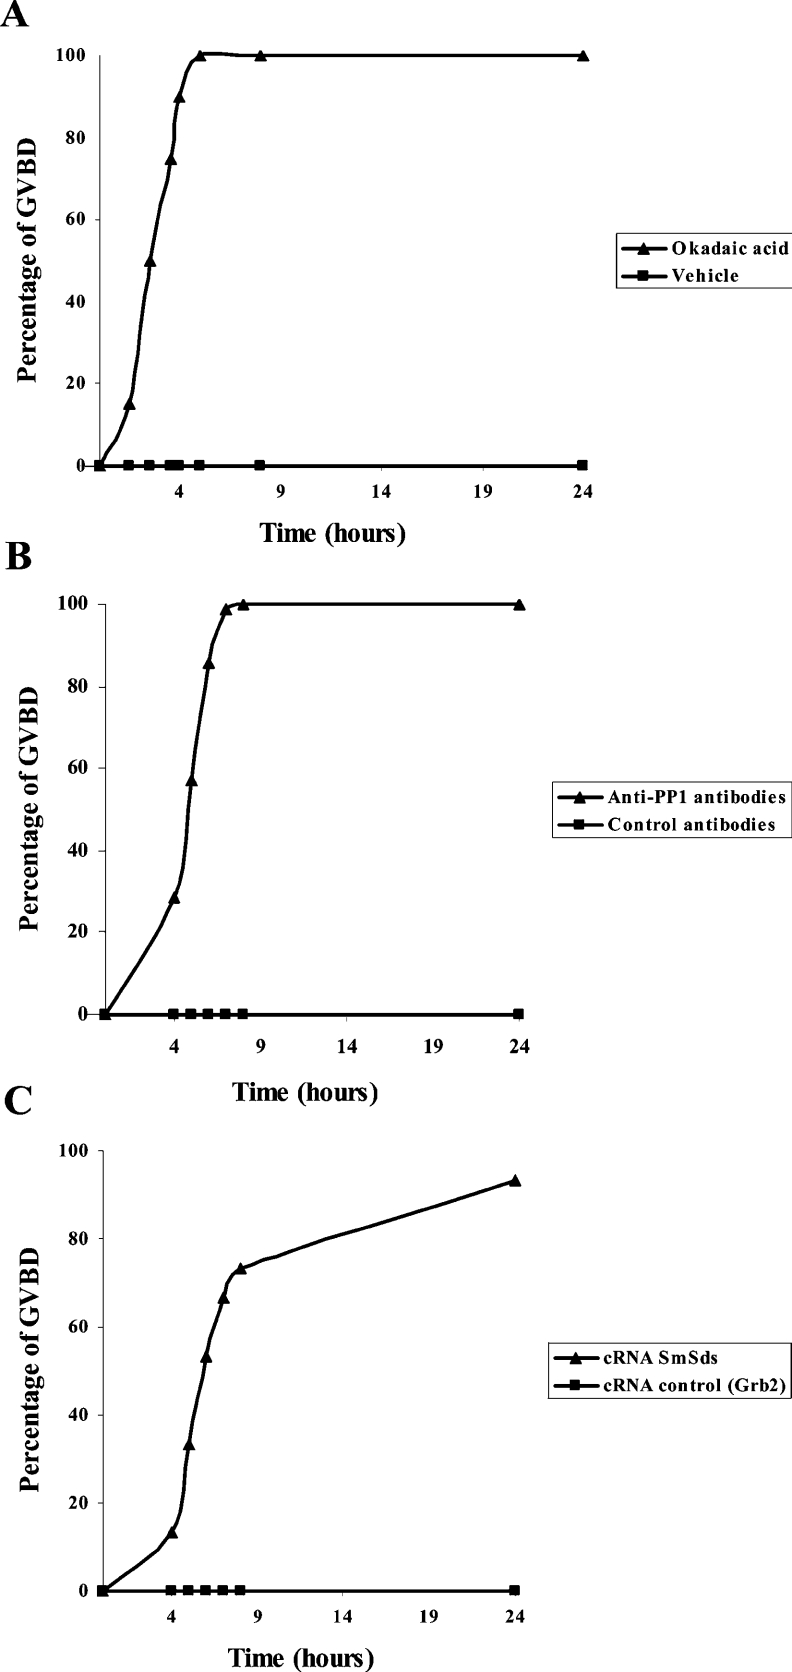
Figure 7. Induction of GVBD in Xenopus oocytes.
Appearance of GVBD was monitored for 24 h after microinjection, and values are presented as percentages. Each experiment was performed using a set of 20 oocytes and was repeated two or three times. The kinetic study shown is representative of one experiment. (A) Percentage GVBD induced with 10 μM OA (▲) or vehicle (■). (B) Percentage GVBD induced with 100 nl of mouse anti-PP1 serum (▲) or control serum (■). (C) Percentage GVBD induced by the microinjection of 100 ng of SmSds cRNA (▲) or control cRNA (■).

