
Figure 4.
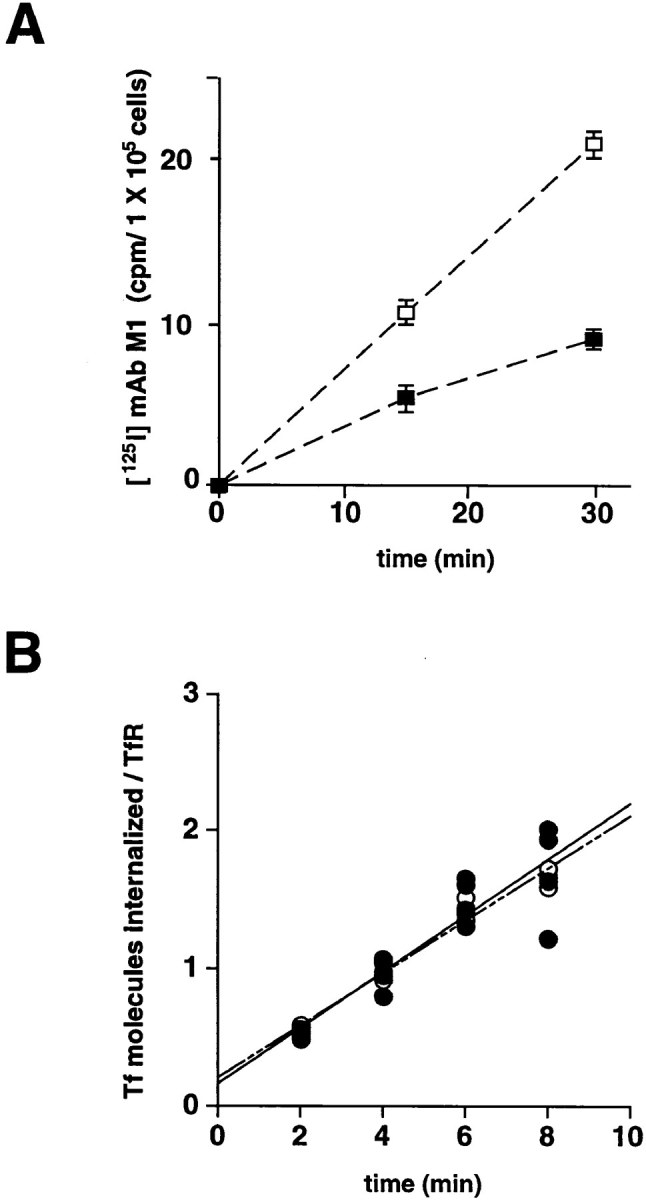
Quantitative internalization of [125I]-mAb M1 and [125I]-transferrin into M2 and A7 cells. (A) Parallel plates of M2 (□) and A7 (▪) cells were infected with VV: hfur/f (moi = 10). 4 h after infection, [125I]-mAb M1 was added to the culture medium. Control plates were placed on ice immediately and the remaining samples were incubated at 37°C for the indicated times, and then transferred to ice. At the indicated times, the supernatants were removed, the cells washed twice, and then incubated with Proteinase K. The detached cells were suspended in fresh medium, pelleted through a serum pad, and the amount of internalized [125I] was determined. For each time point, the counts from the control sample were subtracted from the value of the assay sample. Experiments using non– epitope-tagged furin showed no detectable increase in signal over background. All time points were measured in triplicate. Bars indicate standard deviations. (B) The measurement of [125I]-transferrin uptake into M2 (○) and A7 (•) cells was performed as described in Materials and Methods. Cells were incubated with 35 nM [125I]-transferrin for the indicated times at 37°C. At the end of each time point, cells were transferred to 4°C and washed with mild acid to remove cell surface transferrin. The cells were solubilized with NaOH and counted in a gamma counter. Binding assays at 4°C were performed simultaneously with each assay to determine the number of transferrin receptors on the cell surface.