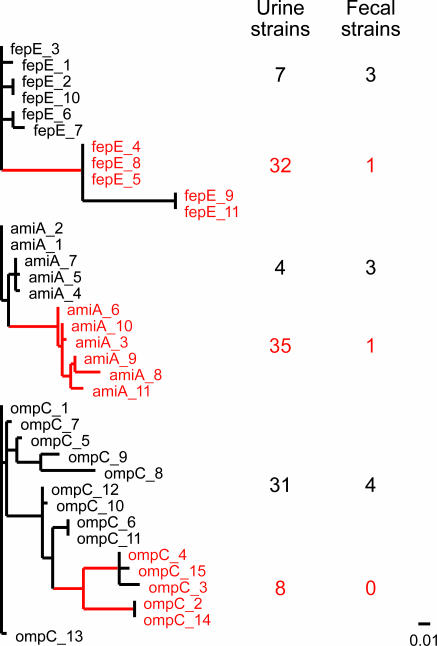
Fig. 2.
amiA, fepE, and ompC are under selection in clinical UPEC isolates. Phylogenetic trees of unique sequences for each gene are shown. Red branches/labels indicate foreground branches that show evidence for positive selection (see Table 2 and text). Red numbers to the right of the tree indicate the number of urine and fecal isolates represented by the red (foreground) labels in the phylogenetic tree. Black numbers to the right of the tree indicate the number of urine and fecal isolates represented by black labels in the phylogenetic tree. The sites of isolation of strains represented by sequence labels are summarized in Table 4. Scale bar for phylogenetic trees is shown at the bottom right.

