Fig. 3.
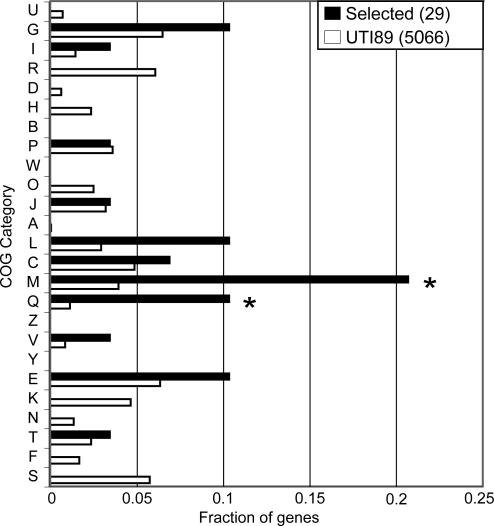
UPEC-selected genes are enriched for genes in two COG functional categories. COG category codes are indicated on the y axis. The fraction of genes in each COG category is shown on the x axis. Black bars indicate genes under positive selection in UPEC strains (n = 29). Open bars are for all genes annotated in UTI89 (n = 5,066). COG categories that are significantly enriched (P < 0.05, binomial test) in the set of UPEC-selected genes relative to all UTI89 genes are indicated by an asterisk. COG category codes are as follows: U, intracellular trafficking and secretion; G, carbohydrate transport and metabolism; I, lipid transport and metabolism; R, general function prediction only; D, cell cycle control, mitosis and meiosis; H, coenzyme transport and metabolism; B, chromatin structure and dynamics; P, inorganic ion transport and metabolism; W, extracellular structures; O, posttranslational modification, protein turnover, chaperones; J, translation; A, RNA processing and modification; L, replication, recombination and repair; C, energy production and conversion; M, cell wall/membrane biogenesis; Q, secondary metabolites biosynthesis, transport and catabolism; Z, cytoskeleton; V, defense mechanisms; Y, nuclear structure; E, amino acid transport and metabolism; K, transcription; N, cell motility; T, signal transduction mechanisms; F, nucleotide transport and metabolism; and S, function unknown.

