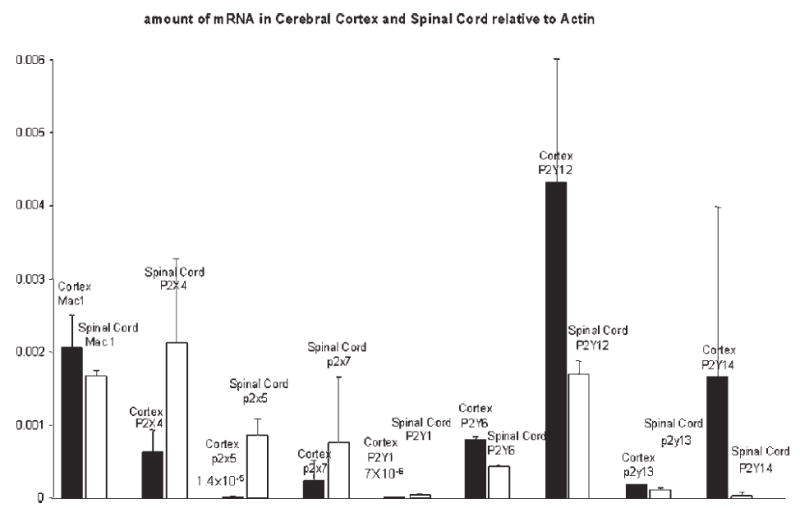
Fig. 5. Real-time PCR of P2 receptor mRNA in cerebral cortex and spinal cord.

The amount of mRNA in cerebral cortex and spinal cord, relative to actin, from two mice determined by the comparative Ct method. Each primer–probe set was run in triplicate. Note that the relative amount of each P2 receptor is the same magnitude as that in mixed astrocyte/microglia cultures. Data are mean ± S.D.
