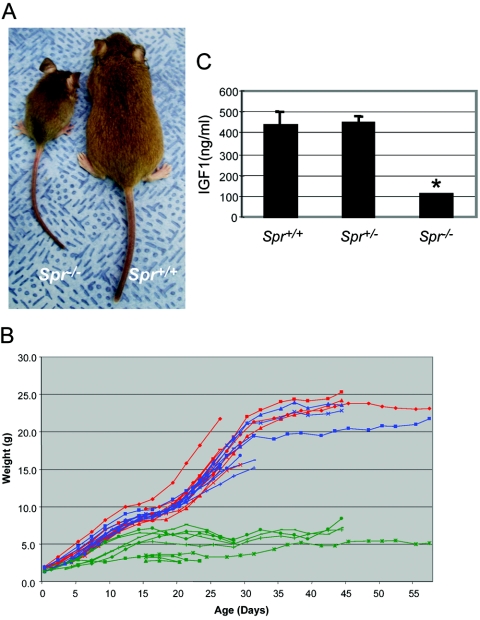
Figure 2.
Growth of Spr−/− mice and serum IGF1 levels. A, A 45-d-old Spr−/− mouse with dwarfish compared with an Spr+/+ littermate. B, Growth curves of Spr+/+ (red), Spr+/− (blue), and Spr−/− (green) mice. Each line represents an individual mouse. C, Serum IGF1 levels. Three 4-wk-old mice of each genotype were tested. Values are means (and SE is indicated above each bar). *P<.01, compared with Spr+/+ mice, as determined by Student’s t test.

