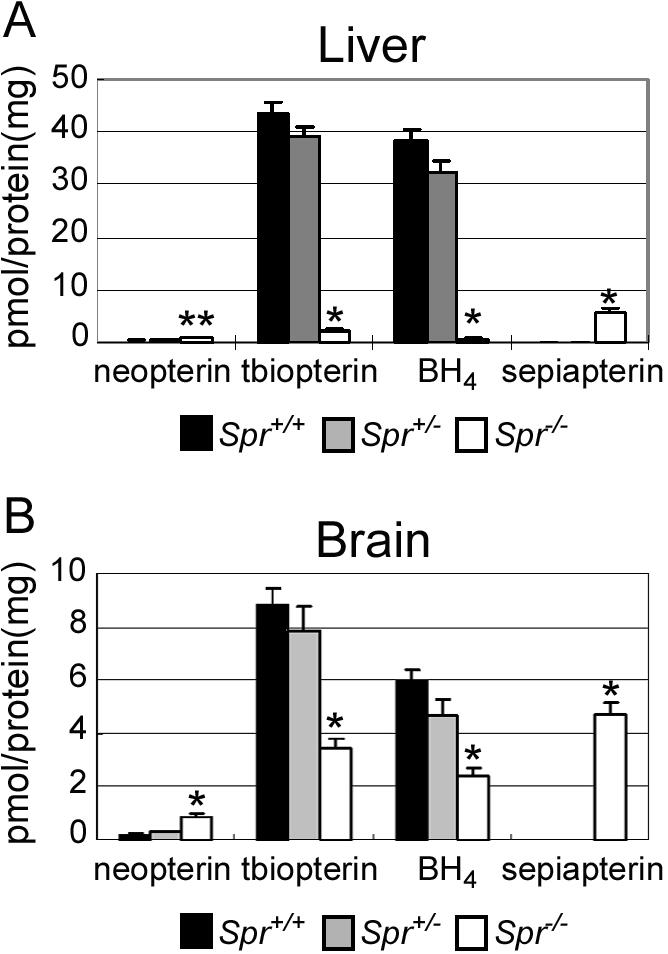
Figure 3.

Pteridine levels. Neopterin, total biopterin (tbiopterin), BH4, and sepiapterin levels in the liver (A) and brain (B) are shown. Six Spr+/+, six Spr+/−, and eight Spr−/− mice were used for the liver tests. Eight mice of each genotype were used for the brain tests. Values are means (and SE is indicated above each bar). *P<.001 and **P<.01, compared with Spr+/+ mice, as determined by Student’s t test.
