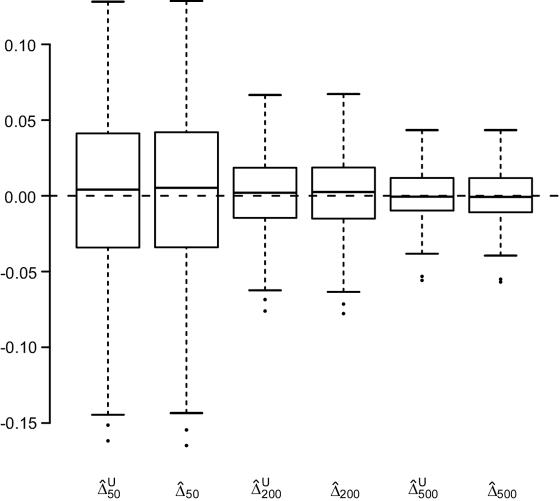
Figure 2.
Boxplots of biases for the two estimators  and
and  . From a simulated population of N=4,000 haplotypes, 300 random samples of n haplotypes were drawn for n=50, 200, and 500.
  and
and  were calculated for a particular marker pair located 5 kb apart. The six boxplots (from left to right) are for
  ,
,  ,
,  ,
,  ,
,  , and
, and  , where the numbers in the subscript denote the sample size, n.

