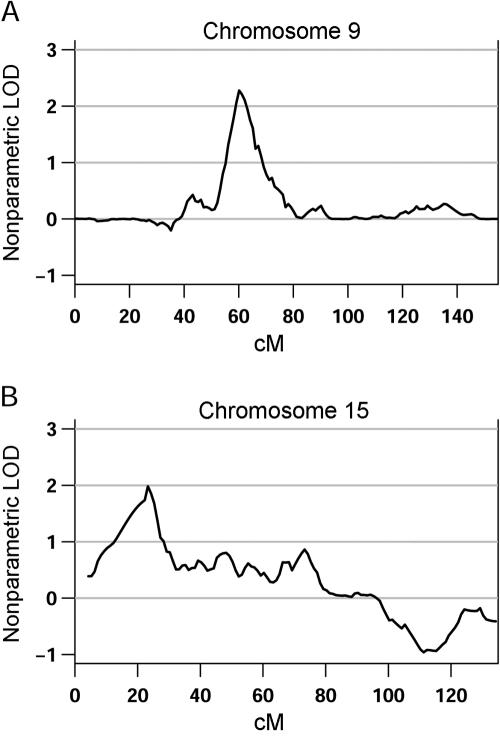
Figure 2.
Close-up of the chromosomes with the highest evidence for linkage in the primary analysis for each phenotype definition. Chromosome 9, with a LOD score of 2.3 at 60 cM (A), and chromosome 15, with a LOD score of 1.95 at 23 cM (B), showed the highest evidence for linkage by use of the broad and narrow phenotype definitions, respectively.

