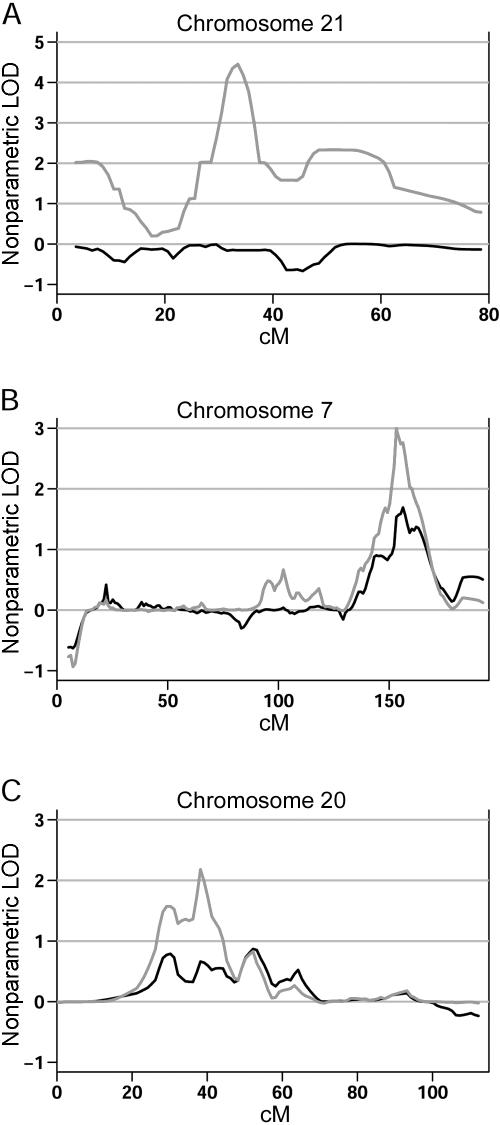
Figure 3.
Sex-specific evidence for linkage. A, Analysis of the female-only data set (gray line) compared with the complete data set (black line) on chromosome 21, showing significant increase in the LOD score when only females are classified as affected. B, Similar significant increase in the evidence for linkage on chromosome 7 when the male-only data set (gray line) is compared with the complete data set (black line). C, Increased evidence for linkage also observed in the male-only data set (gray line) on chromosome 20.

