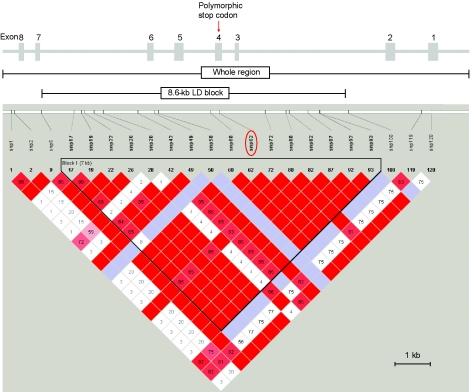
Figure 2.
Structure of the caspase-12 gene. The exon-intron structure—including exon 3, which is present only in some transcripts—is shown at the top, as is the whole sequenced region and the location of the 8.6-kb LD block. The lower part of the figure shows the LD block identified using Haploview. Each square represents a pairwise value of D′, with the standard color coding (red indicates LOD⩾2 and D′=1; pink indicates LOD⩾2 and D′<1; blue indicates LOD<2 and D′=1; white indicates LOD<2 and D′<1).

