
Fig. 3.
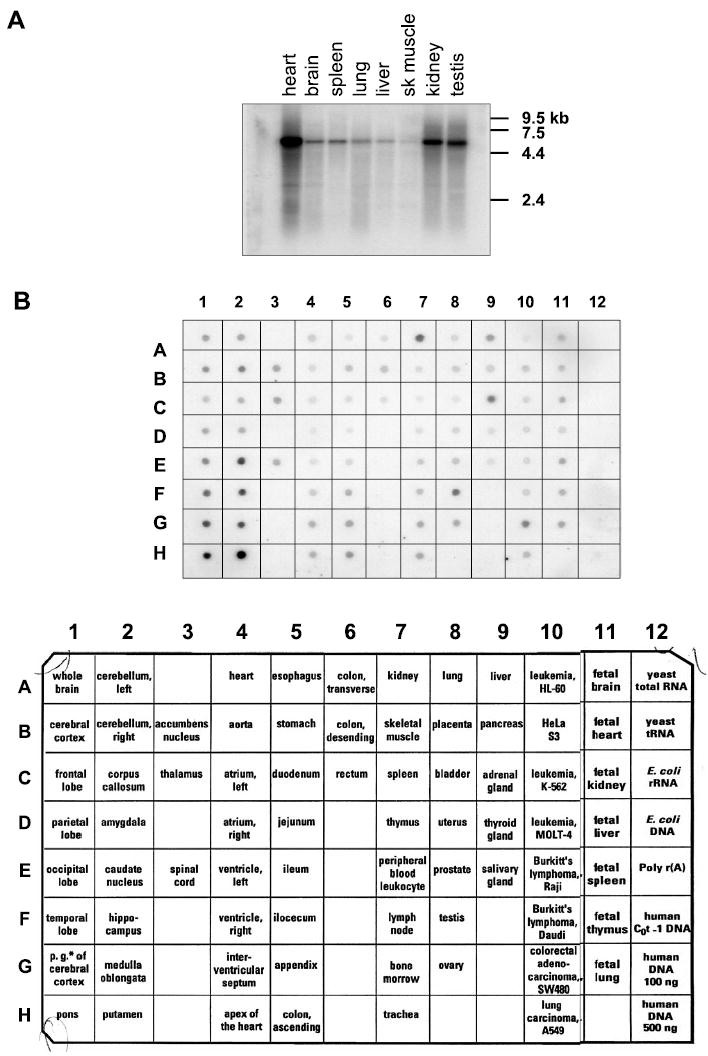
Expression of MAST205 transcript. A: Northern analysis of MAST205 mRNA on a blot containing mRNA from 8 rat tissues showing the presence of ~5.5 kb transcript in all tissues. B: multiple tissue expression (MTE) array of MAST205. Strongest signals were obtained in kidney (7A), testis (8F), adrenal gland (9C), and brain (1F–H, and 2E–H). Description of the RNA spotted on the MTE array is shown on bottom. Columns 1–11: poly(A)+RNA samples from human tissues; column 12: controls, poly(A)+RNA and DNA.