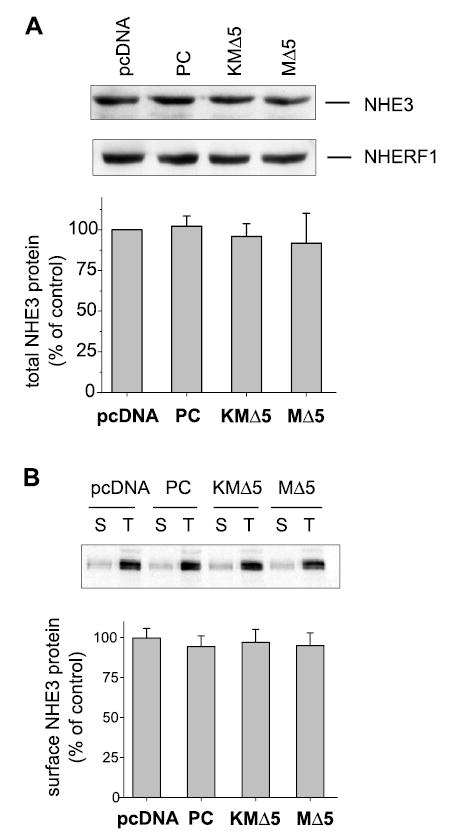
Fig. 8.

Effect of MAST205 on NHE3 protein abundance in OK cells. A: OK cells were transfected with pcDNA, PC, MΔ5, or KMΔ5. Total cellular NHE3 protein abundance (40 μg) was determined on lysates by Western immunoblot using the OK NHE3 antibody 3H3. A representative immunoblot is shown. Equal loading of the samples was tested by determining the amount of NHERF1 by Western blot. Bottom: quantification of NHE3 expression normalized to NHERF1 expression level from 6 different experiments. Results are presented as means ± SD. B: cell surface NHE3 was determined by biotin-labeled and streptavidin-precipitated NHE3 from lysates prepared from transfected OK cells. Total protein (60 μg) and surface-biotinylated proteins (all streptavidin precipitated) were loaded, and the amounts of NHE3 were determined by immunoblot. A representative immunoblot and the quantification from three sets of experiments are shown. Results are presented as means (bars) and SD (error bars); n = 3.
