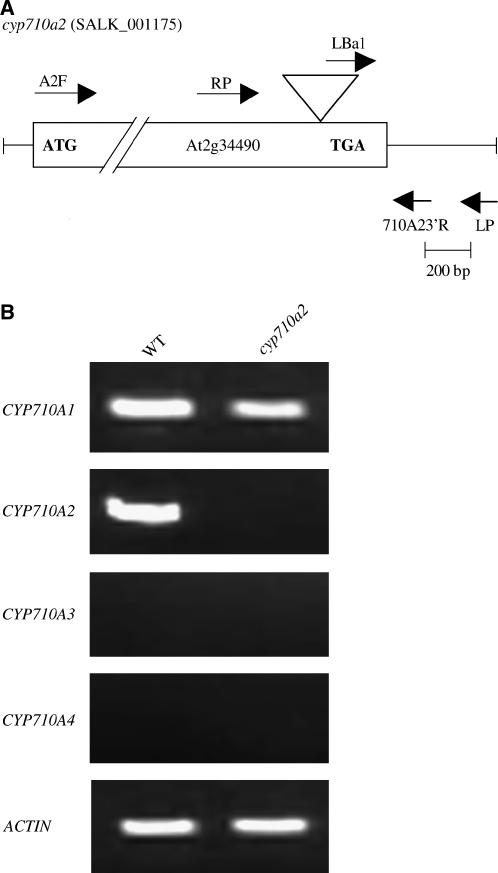
Figure 6.
T-DNA Insertion Mutagenesis.
(A) Schematic diagram of the T-DNA insertion event within CYP710A2 in the cyp710a2 line (SALK_001175). The primers (Table 3) used for the analysis of the T-DNA insertion are shown.
(B) Expression levels of CYP710A genes (CYP710A1, CYP710A2, CYP710A3, and CYP710A4) in the cyp710a2 line.

