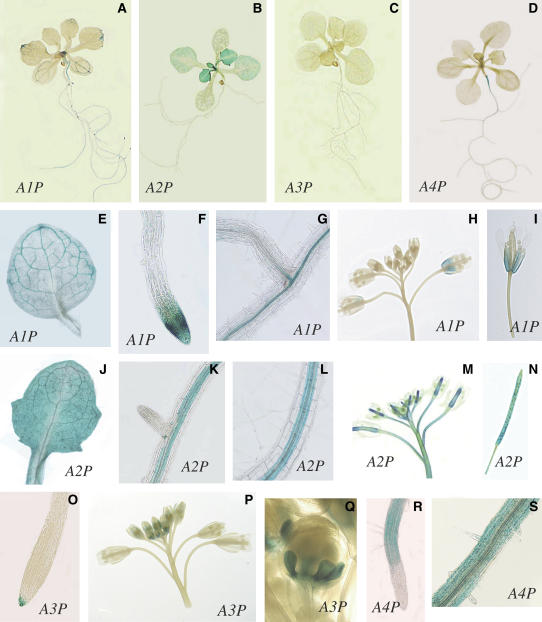
Figure 8.
Promoter:GUS Staining.
Promoter:GUS fusion analyses for differential expression patterns of CYP710A1 (A), CYP710A2 (B), CYP710A3 (C), and CYP710A4 (D). Tissue-specific expression patterns are shown for CYP710A1 ([E] to [I]), CYP710A2 ([J] to [N]), CYP710A3 ([O] to [Q]), and CYP710A4 ([R] and [S]).

