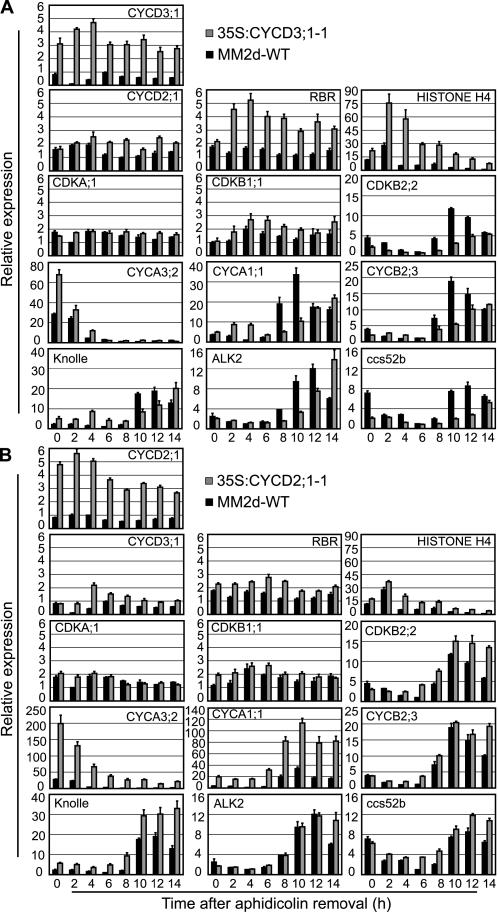
Figure 4.
35S:CYCD3;1 Delays the Activation of G2/M-Phase Genes.
Expression of the genes indicated using RNA prepared from the synchronized cell samples in Figure 3 was monitored by quantitative RT-PCR using Actin-2 as an internal control. Error bars indicate se; n = 4.
(A) Relative expression of genes in line 35S:CYCD3;1-1 compared with the wild type (MM2d) relative to the lowest expression observed in the experiment, except CYCD3;1, which is presented relative to the maximum wild-type expression (wild type, black bars; 35S:CYCD3;1-1, gray bars).
(B) Relative expression of genes in line 35S:CYCD2;1-1 compared with the wild type (MM2d) as for (A) (wild-type, black bars; 35S:CYCD2;1-1, gray bars).

