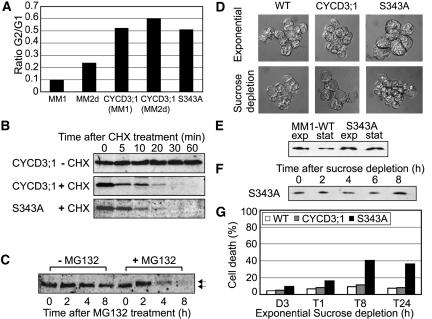
Figure 8.
Characterization of CYCD3;1 Mutant S343A.
(A) Flow cytometry analysis of early stationary phase cells (day 7) in the cell lines indicated, presented as the relative distribution of G1:G2 cells in the population and showing the greater propensity of CYCD3;1– and CYCD3;1-S343A–expressing cells to exit division in G2-phase.
(B) Cells expressing CYCD3;1 or CYCD3;1-S343A were incubated with (+) or without (−) cycloheximide (CHX) for the times indicated, and extracts were analyzed by immunoblotting with anti-CYCD3;1 antibody.
(C) Exponentially growing cells from line CYCD3-S343A (day 4) were washed twice with MS medium to remove sucrose, resuspended, and treated with (+MG132) or in the absence of (−MG132) 100 μM MG132 for the times indicated. After protein extraction, CYCD3;1 was detected by protein gel blot analysis. Normal and hyperphosphorylated bands were detected for CYCD3-S343A, as observed previously with similar kinetics for wild-type CYCD3;1 (Planchais et al., 2004).
(D) Cell morphology in exponentially growing cells (day 3; top) and after 24 h of sucrose depletion (bottom) in the wild type (MM1), 35S:CYCD3;1, and CYCD3-S343A.
(E) Protein gel blot analysis of CYCD3;1 during exponential growth (exp; day 3) and early stationary phase (stat; day 7) in the cell lines indicated.
(F) Midexponentially growing cells of line 35S:S343A (day 3) were washed twice in MS medium (lacking sucrose), resuspended, and diluted in MS medium (dilution, 1:5) as described for Figure 2A. For protein gel blot analysis of CYCD3;1, samples were taken every 2 h.
(G) Effect of ectopic CYCD3;1 expression on viability in response to sucrose depletion. Midexponentially growing cells (day 3) were washed twice in MS medium (lacking sucrose), resuspended, and diluted in medium containing no sucrose (dilution, 1:5). Samples were taken as indicated and subjected to trypan blue staining to determine the percentage of dead or dying cells.

