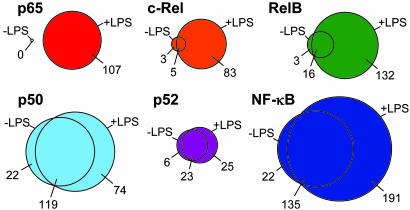
Fig. 1.
The overlap between genes bound before and after LPS stimulation by each NF-κB subunit and all NF-κB subunits together, displayed as Venn diagrams. The number of genes occupied by each subunit exclusively in unstimulated cells, exclusively in LPS-stimulated cells, or occupied in both are indicated. All binding events are significant at a P value threshold of 0.002.

